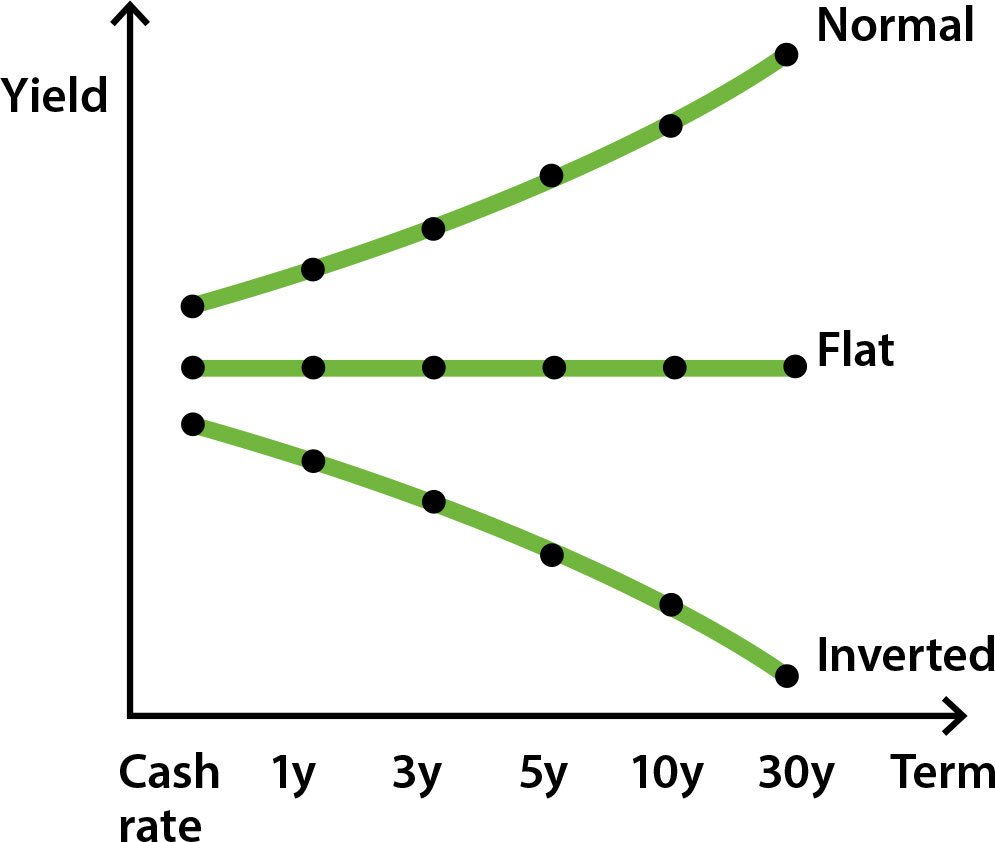
The bond yield curve is a graphical representation of interest rates for bonds of different maturities. It shows the relationship between bond yields (interest rates) and their respective time to maturity. Bond yield curves can take different shapes, each indicating distinct market conditions. Let’s explore three common types of bond yield curves with simple explanations and example images:
Normal Yield Curve
- A normal yield curve slopes upwards, with longer-term bonds having higher yields than shorter-term bonds.
- This shape indicates a healthy economy, where investors expect higher interest rates in the future.
- It reflects the idea that longer-term bonds carry more risk due to potential changes in inflation and economic conditions.
Inverted Yield Curve
- An inverted yield curve slopes downwards, with shorter-term bonds having higher yields than longer-term bonds.
- This shape suggests that investors expect lower interest rates in the future, which can signal a possible economic slowdown.
- Investors may buy longer-term bonds as a safety measure, anticipating lower interest rates in the future.
Flat Yield Curve
- A flat yield curve has little to no slope, indicating that yields are relatively similar across different maturities.
- This shape may occur during periods of uncertainty or economic transition when investors are unsure about future interest rate movements.
- A flat yield curve can also signal an economy transitioning from expansion to contraction or vice versa.
Bond yield curve analysis is an essential tool for investors, as it provides insights into the market’s perception of future interest rates and economic conditions. However, it’s essential to remember that yield curve shapes are not absolute predictors of future economic events. Economic conditions are influenced by various factors, and other indicators should also be considered when making investment decisions.
